

Here's another way to visualize this 4D object. The original Mandelbrot rendering method samples 4D points from a 2D slice and renders a map of the ultimate fate of the iterated samples. The points determined to be inside the M-Set are typically rendered black. The standard Mandelbrot images are from the Z==0 plane whereas Julia-Set images are taken from other slices parallel to the Z==0 plane. A sequence of images can then be made from stepping through various distances from the Z==0 plane and the collection of all the black regions can be though of as one solid object. Unfortunately that object is still 4D so we'll still need to choose a 3D projection in order to visualize that solid. The simplest projection from 4D to 3D is just to ignore one of the dimensions. What this means is that instead of always initializing both Z values to 0, we'll just initialize one of the initial Z components to 0 and make a sequence of Julia Set images where the other component ranges from say -3 to 3. There are therefore 2 such natural 3D projections. One where the Z-real component is held at 0 and Z-imaginary ranges, and one where Z-imaginary is always initialized to 0 and Z-real varies.
Ok so that will give us a stack of images with a black 3D form in the middle, but how to render that 3D object? Well, the best way would be to use a 3D lithography machine to 'print' a real 3D object. That's still rather expensive to do so let's try some other approaches. A simple solution is to create an image from each slice and then make an animated movie that flips through those images. Here are those two movies:

|

|
| Slices at Z-real = 0
|
Slices at Z-imaginary = 0 |
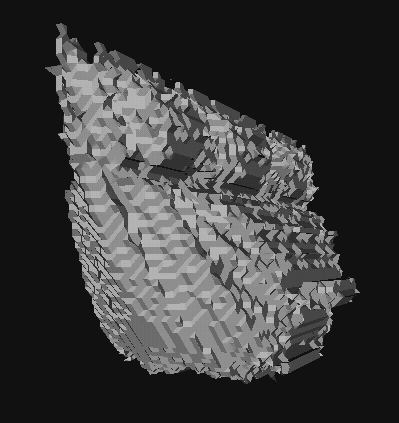
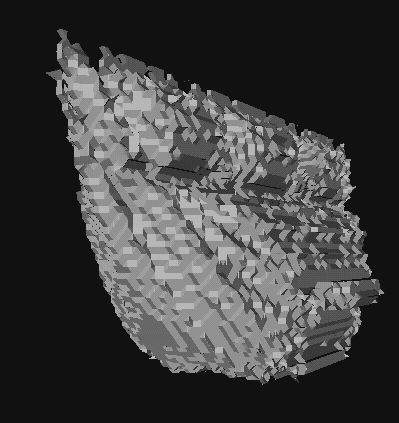
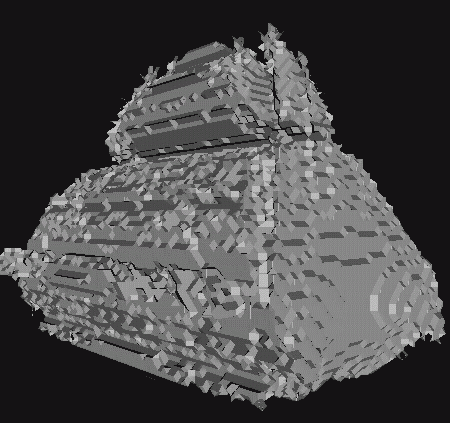
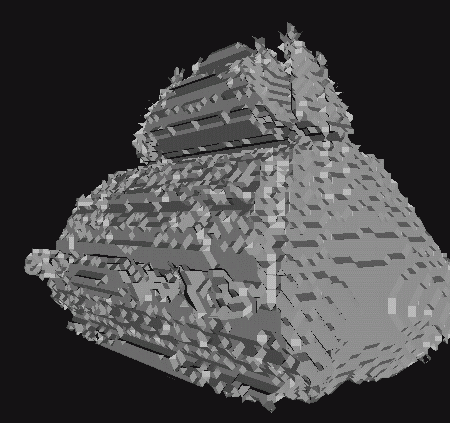
An algorithm called "Marching Cubes" can take a 3D data array such as this and produce a 2D isosurface for any given data threshold. Isosurfaces are the 3D equivalent of the familiar 2D 'isobar' weather maps showing lines of identical temperature or pressure. In this 3D case all points on a 2D isosurface represent points with identical exit values. If the black points in the Mandelbrot Set are indicated by 0 values then a reasonably faithful isosurface of the M-Set can be produced using a threshold value of 0.5. Here are renderings of those two isosurfaces produced from the above data slices. You can click the following links for the 3D VRML models from which these screen shots were snapped of the
Z-real==0 and
Z-imaginary==0 isosurfaces. Note that each stereo image is less than half a megabyte but each VRML file is over 2 megabytes plus you'll need a VRML browser plug-in to see and manipulate them.
 |
 |
 |
 |
| The Z-imaginary==0 surface is more of a wedge shape looking a lot like a Viking ship complete with stubby oars along its sides. In this case you can also make out the main Mandelbrot shape adorning the bowsprit. It is much more prominent when viewed in 3D.
|
The Z-imaginary==0 surface is more of a wedge shape looking a lot like a Viking ship complete with stubby oars along its sides. In this case you can also make out the main Mandelbrot shape adorning the bowsprit. It is much more prominent when viewed in 3D.
|
 |
 |
 |
 |
| The Z-real==0 surface looks a lot like a pagoda. You can just make out the silhouette of the main mandelbrot shape along the short walls.
|
The Z-real==0 surface looks a lot like a pagoda. You can just make out the silhouette of the main mandelbrot shape along the short walls.
|
 |

|
Not a surface, but another way to view the inside vs. outside nature of the full 4D object is to compute a lot of random initial 4D points and plot them as a density field. The left above image shows one frame from a movie showing a rotation of a projection of this field in 3D. Click the image to see the animation. Each dark dot in this space represents an initial point determined to be inside the 4D m-set. This makes it a true 4D analog of the 2D black & white Mandelbrot images (on right) where the points in the m-set are colored black.
Marching Cubes implementation courtesy of Marcus Hewat.